
Written by
Yuri ZhangWhen our Windows PC crashes with a dreaded Blue Screen of Death (BSOD), it often leaves behind a memory dump file (memory.dmp).
This file contains valuable information that can help us identify what caused the crash: a driver, a hardware fault, or a system bug. Let's learn how to read and analyze that file, whether you are a pro or an amateur.
Where is the memory dump file?
A memory.dmp file is a snapshot of your system's memory when it broke down. It's automatically created by Windows when a system failure occurs. The file may be large (full dump) or small (mini dump), and it's typically found in the path:
C:\Windows\memory.dmp and C:\Windows\Minidump\ in Windows File Explorer.
Given its large file size, which can reach several GBs, you may choose to delete memory.dmp file once everything is confirmed to be in order.
Tools to open and read memory.dmp
Learning how to read memory.dmp files is a valuable skill, especially for tech support, system admins, and curious PC users. There are three main memory.dmp readers in the market.
1. WinDbg (Windows Debugger)
Known as the official Microsoft tool, this is the most powerful and accurate way to examine dump files. Here's how to read and analyse:
- Download Debugging Tools for Windows via the Windows SDK. Choose only the debugger component during installation.
- Launch WinDbg (x64).
- Open your dump file by clicking File > Open Crash Dump.
- In the command field, type:!analyze -v
This command gives a verbose analysis including error codes, the likely culprit (like a faulty driver), and stack traces. (Optional: Symbols help WinDbg read the file more accurately. Set your symbol path to: srv*C:\Symbols*https://msdl.microsoft.com/download/symbols. Then reload the file or run !analyze -v again.)
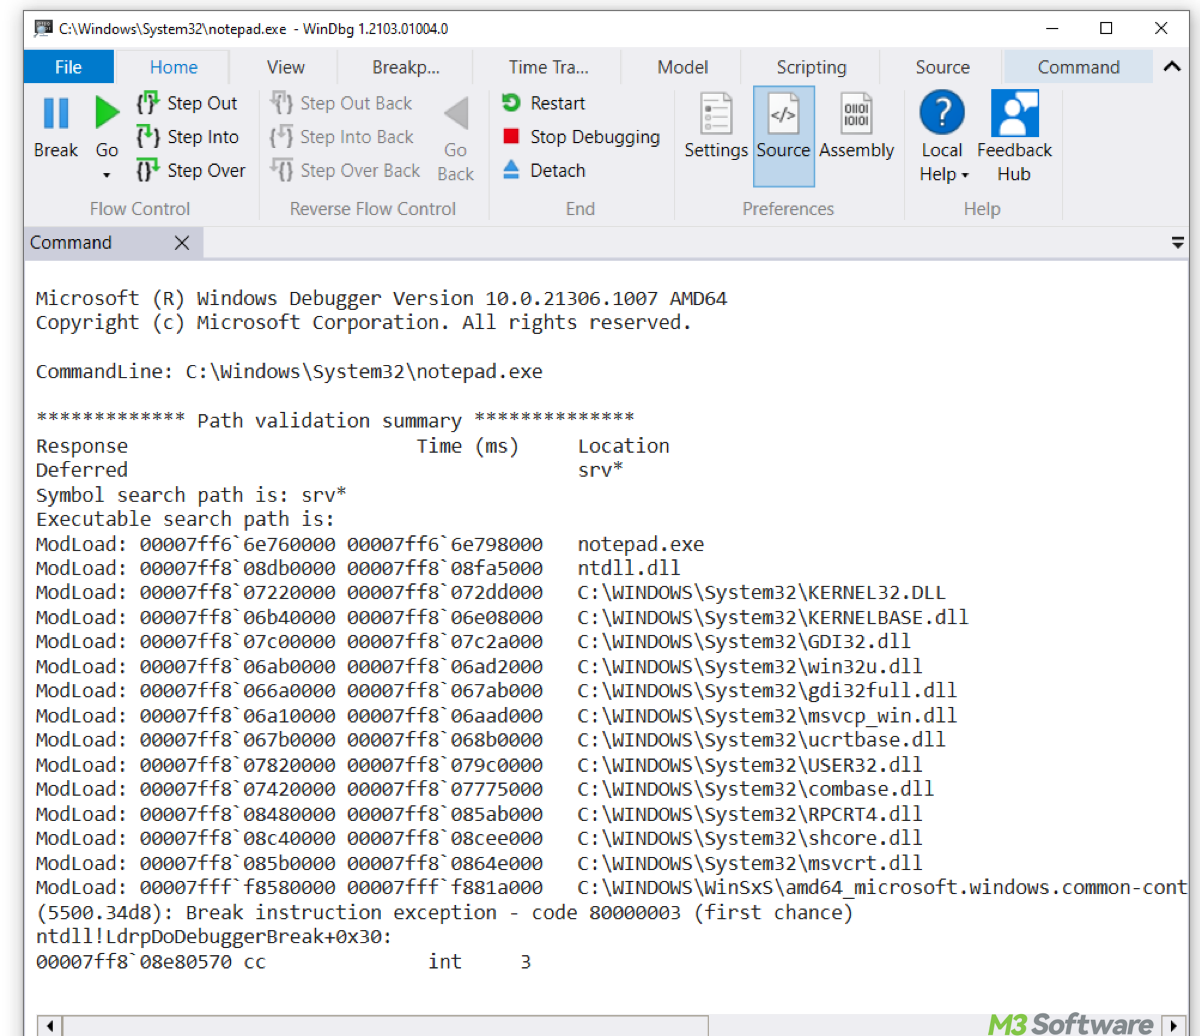
If you are analyzing a dump that was created while Notepad was running (or if you manually attached to Notepad), WinDbg will show notepad.exe.
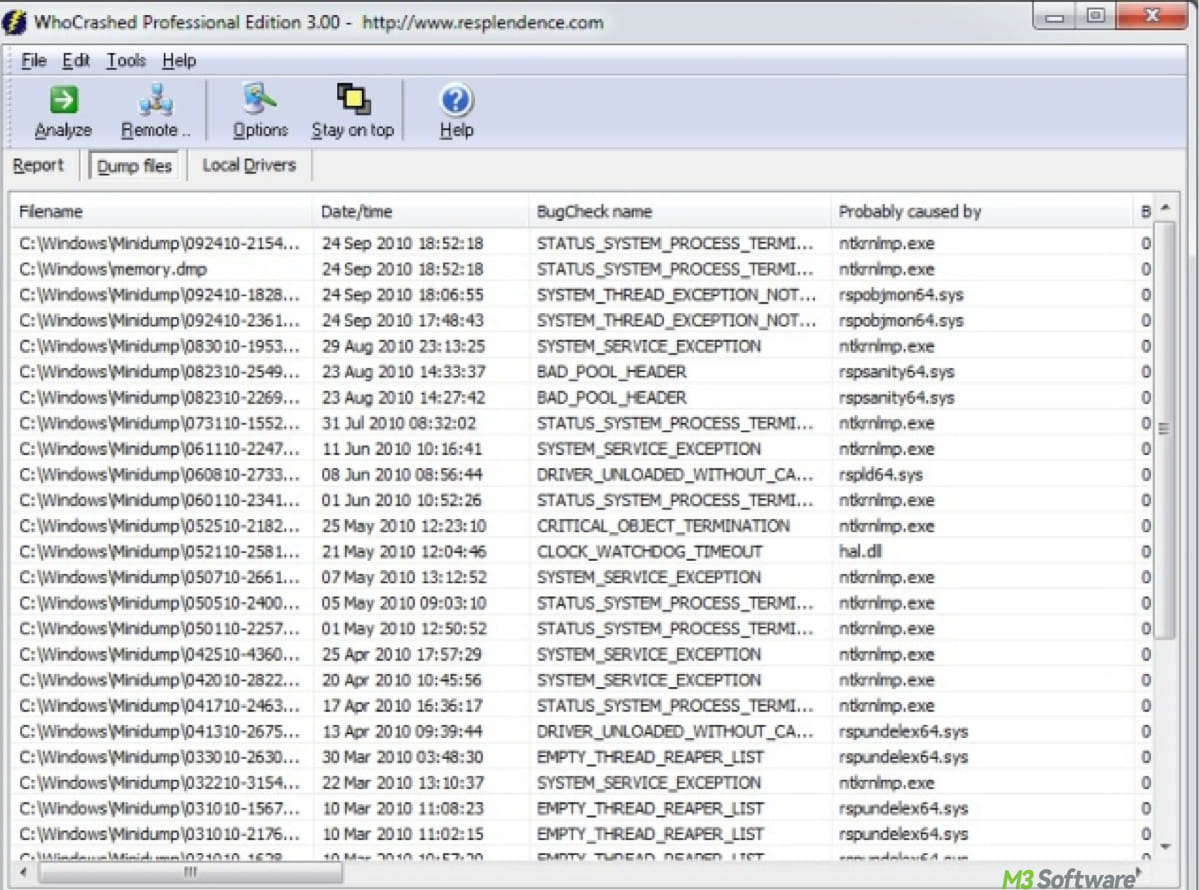
2. WhoCrashed
WhoCrashed provides a simplified summary of crash causes and is suitable for everyday users. Its beginner-friendly interface may appeal to you. You can download and install it through its official website and then click “Analyze” to view the likely cause of each crash.
Whether you use the official WinDbg debugger or opt for a user-friendly tool like WhoCrashed, you'll be better equipped to understand and resolve the causes behind system crashes. Share these cherished tips!
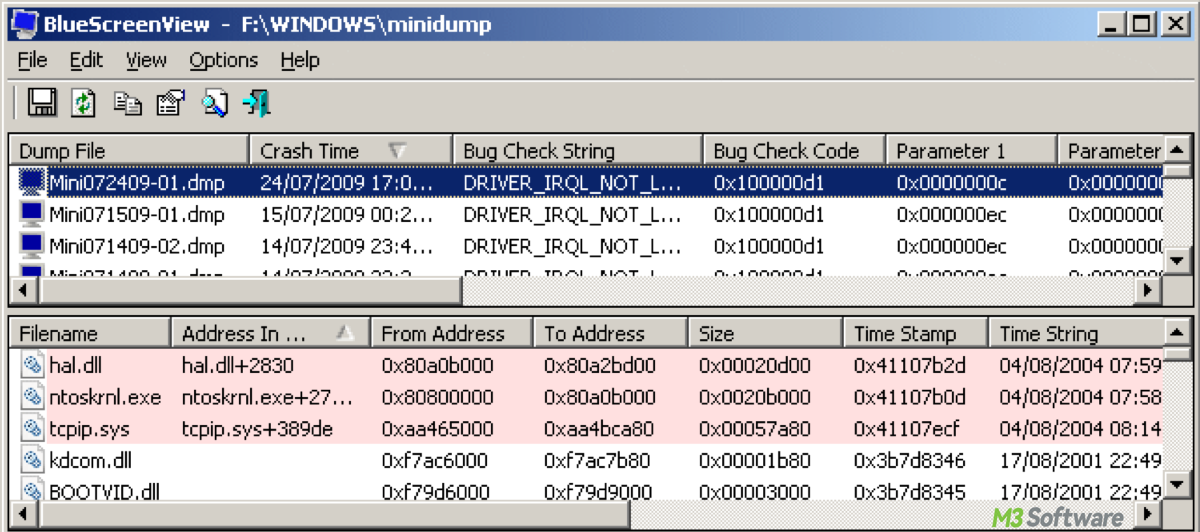
3. BlueScreenView
BlueScreenView displays mini dump contents in an easy-to-read format, highlighting problematic drivers and BSOD stop codes. It's a good lightweight utility when your computer is under a heavy load.
Download it from the NirSoft BlueScreenView official website. It will show bug check codes, error strings, and related drivers.
Sample memory.dmp analysis report
There is a report output example via !analyze -v:
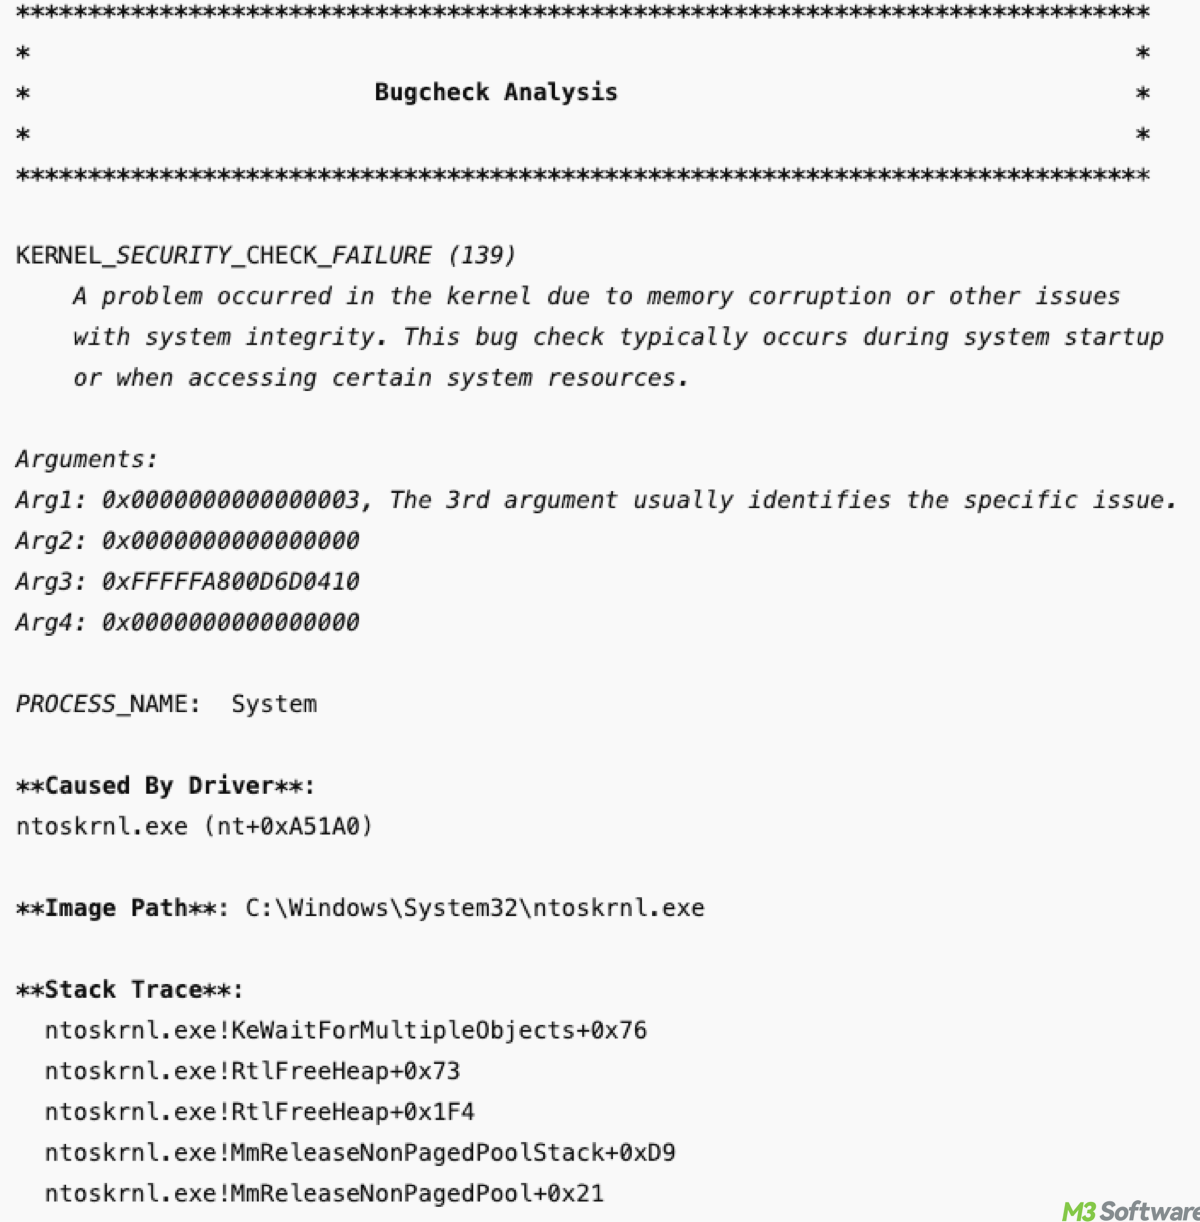
Breakdown of key information:
- KERNEL_SECURITY_CHECK_FAILURE (139) suggests a memory corruption or system integrity issue.
- The arguments (Arg1, Arg2, Arg3, Arg4) provide more specific details that WinDbg uses for analysis.
- ntoskrnl.exe is the Windows kernel responsible for managing hardware and system resources. A problem here typically indicates an issue with system memory or corrupted drivers. This could mean either a faulty driver or a system resource conflict.
- The Stack Trace shows the function calls leading up to the crash, helping identify what part of the system or application was active when the crash occurred.
What to do next:
- If the analysis points to ntoskrnl.exe or other system files (like drivers), you can update drivers or reinstall problematic drivers via Device Manager.
- Since the error mentions memory corruption, it's possible that bad RAM is the culprit. Use Windows Memory Diagnostic (mdsched.exe) or third-party tools like MemTest86 to check your RAM.
- Corrupted system files could be causing the issue. Run sfc /scannow in Command Prompt to scan and fix system files.
- Malware can sometimes cause memory corruption. Run a full strange memory scan with Windows Defender or a third-party antivirus program.
- If no driver or software issue is found, consider that there may be a hardware failure (e.g., faulty RAM, motherboard, etc.). Use hardware diagnostics tools provided by your PC's manufacturer, such as Support Assist of Dell.
- If the issue persists, consider performing a System Restore to a point before the crashes started. Alternatively, a Windows Reset may help if no other solution works.
Final tips
It is advised to delete the dump files if you have the analysis results. Keep the reports for post-mortem debugging. If the issue is recurring, compare multiple dump files for a pattern. Interpreting these files can lead to faster resolution and system stability for developers or IT professionals.
Related article:
Recovery Partition: A Hidden Place to Troubleshoot Windows
Spread this post to help others open and read this seemingly strange memory.dmp file.